8  Time-event (Survival) Analysis and Censored Data

8.1 General concepts

In this models the outcome variable is the time until an event occurs or any other numeric variable have been censored by any limitation during data collection. In consecuence, times are always positive and we need to use distributions like the Weibull distribution.

  • Survival, failure or event time \(T\): Represents the time at which the event of interest occurs. For instance, the time at which the patient dies or the customer cancels his or her subscription.
  • Censoring time \(C\): Represents the time at which censoring occurs. For example, the time at which the patient drops out of the study or the study ends.

As result our target variable is the result of:

\[ Y = \min(T, C) \]

To know how to interpret the results we will need an indicator:

\[ \delta = \begin{cases} 1 & \quad \text{if } T \leq C \\ 0 & \quad \text{if } T > C \end{cases} \]

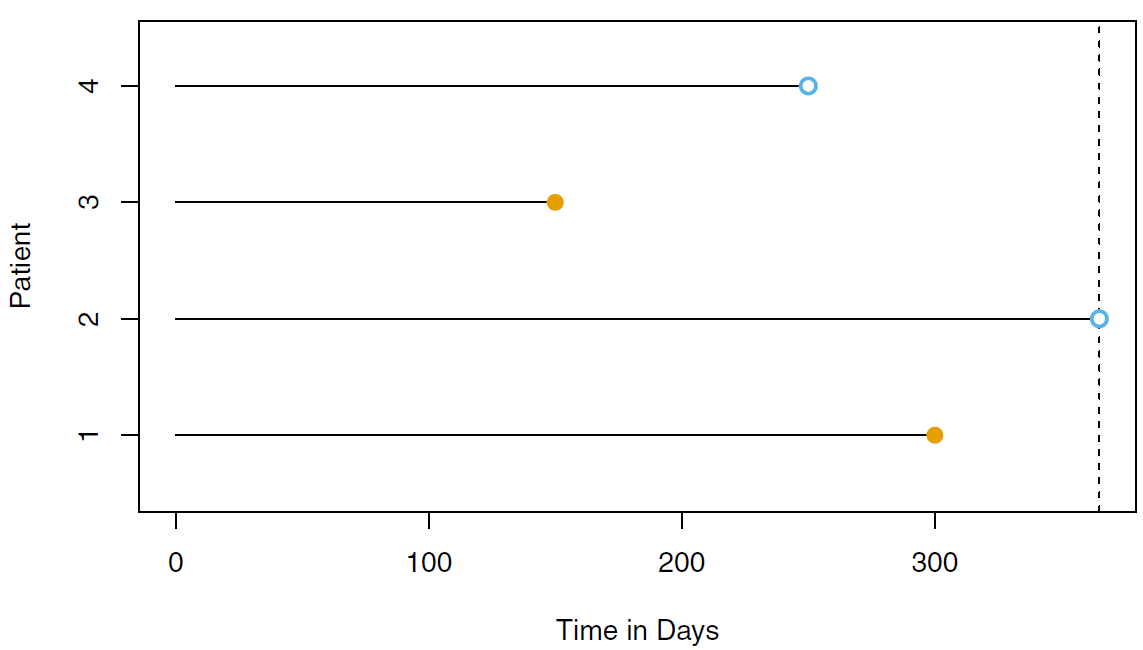
As result when \(\delta = 1\) we observe the true survival time, and when \(\delta = 0\) if we observe the censoring time. In the next example, we just could observe the event for patients 1 and 3 before ending the study.

8.1.1 Case of use

  • The time needed for the individual to find a job again
  • The time needed for a letter to be delivered
  • The time needed for a cab to pick you up at your house after having called the cab company
  • The time needed for a customer to churn.
  • When our measure instrument cannot report values above a certain number.

8.1.2 Assumptions

In order to analyze survival data, we need to determine whether the following assumptions are reasonable:

  • The event time \(T\) is independent of the censoring time \(C\). For example, patients drop out of the cancer study early because they are very sick, that would overestimate the true average survival time. We can check this assumption by exploring the reasons related to dropouts.

  • The predictors are independent of the censoring event \(\delta = 0\). For example, if in our study very sick males are more likely to drop out of the study than very sick females, that would drive the wrong conclusion that males survive longer than females.

8.1.3 Censoring types

  1. Right censoring: It occurs when \(T \geq Y\), i.e. the true event time \(T\) is at least as large as the observed time \(Y\).
  2. Left censoring: It occurs when \(T \leq Y\), i.e. the true event time \(T\) is less than or equal to the observed time \(Y\).
  3. Interval censoring: It refers to the setting in which we do not know the exact event time, but we know that it falls in some interval.

Right censoring will be the main focus of this chapter.

8.2 Kaplan-Meier Survival Curve

The survival curve (function) is defined as the probability that the event time \(T\) happens later than a time \(t\). As result, the larger the value of \(S(t)\), the less likely that the event would take place before time \(t\).

\[ S(t) = \Pr(T > t) \]

To explain how complicated can be to estimate \(S(20) = \Pr(T>20)\) when our target variable is a mix of event and censored times we will use the ISLR2::BrainCancer table as a example.

library(data.table)

BrainCancer <- 
  na.omit(ISLR2::BrainCancer) |>
  as.data.table()

pillar::glimpse(BrainCancer)
Rows: 87
Columns: 8
$ sex       <fct> Female, Male, Female, Female, Male, Female, Male, Male, Fema…
$ diagnosis <fct> Meningioma, HG glioma, Meningioma, LG glioma, HG glioma, Men…
$ loc       <fct> Infratentorial, Supratentorial, Infratentorial, Supratentori…
$ ki        <int> 90, 90, 70, 80, 90, 80, 80, 80, 70, 100, 80, 90, 90, 60, 70,…
$ gtv       <dbl> 6.11, 19.35, 7.95, 7.61, 5.06, 4.82, 3.19, 12.37, 12.16, 2.5…
$ stereo    <fct> SRS, SRT, SRS, SRT, SRT, SRS, SRT, SRT, SRT, SRT, SRT, SRS, …
$ status    <int> 0, 1, 0, 1, 1, 0, 0, 0, 0, 0, 1, 0, 0, 0, 1, 1, 0, 1, 0, 0, …
$ time      <dbl> 57.64, 8.98, 26.46, 47.80, 6.30, 52.75, 55.80, 42.10, 34.66,…
BrainCancer[, .N,
            keyby = .(alive_after_20_months = time > 20,
                      event_time = status)]
   alive_after_20_months event_time  N
1:                 FALSE          0 17
2:                 FALSE          1 23
3:                  TRUE          0 35
4:                  TRUE          1 12
  • Taking the total of patients who were alive after 20 months (\(36+12=48\)) over the total number of patients (\(48/88 \approx 55\%\)) would be a mistake as we cannot assume that event time is lower than 20 (\(T < 20\)) for 17 censored patients.

  • Omitting the \(17\) censored patients might sound as solution but that would under estimate the probability as a patient who was censored at \(t = 19.9\) likely would have survived past \(t = 20\), and would be better to take a advantage of that censored time.

The Kaplan-Meier method shares a solution to this problem.

8.2.1 Empirical explanation


8.2.2 Mathematical explanation

Let’s start defining some important elements:

  • \(d_1 < d_2 < \dots < d_K\): The \(K\) unique death times among the non-censored patients.
  • \(q_k\): The number of patients who died at time \(d_k\).
  • \(r_k\): The number of patients alive and in the study just before \(d_k\), at risk patients.
  • \(\widehat{\Pr}(T > d_j|T > d_{j-1}) = (r_j - q_j) / r_j\): It estimates the fraction of the risk set at time \(d_j\) who survived past time \(d_j\).

And based on the law of total probability

\[ \begin{split} \Pr(T > d_k) = & \Pr(T > d_k|T > d_{k-1}) \Pr(T > d_{k-1}) + \\ & \Pr(T > d_k|T \leq d_{k-1}) \Pr(T \leq d_{k-1}) \end{split} \]

But as it is impossible for a patient to survive past time \(d_k\) if he or she did not survive until an earlier time \(d_{k−1}\), we know that \(\Pr(T > d_k|T \leq d_{k-1}) = 0\) and we can simplify the function and found out that this a recurrent function.

\[ \begin{split} \Pr(T > d_k) = & \Pr(T > d_k|T > d_{k-1}) \Pr(T > d_{k-1}) \\ S(d_k) = & \Pr(T > d_k|T > d_{k-1}) \times \dots \times \Pr(T > d_2|T > d_1) \Pr(T > d_1) \\ \hat{S}(d_k) = & \prod_{j=1}^k \left( \frac{r_j - q_j}{r_j} \right) \end{split} \]

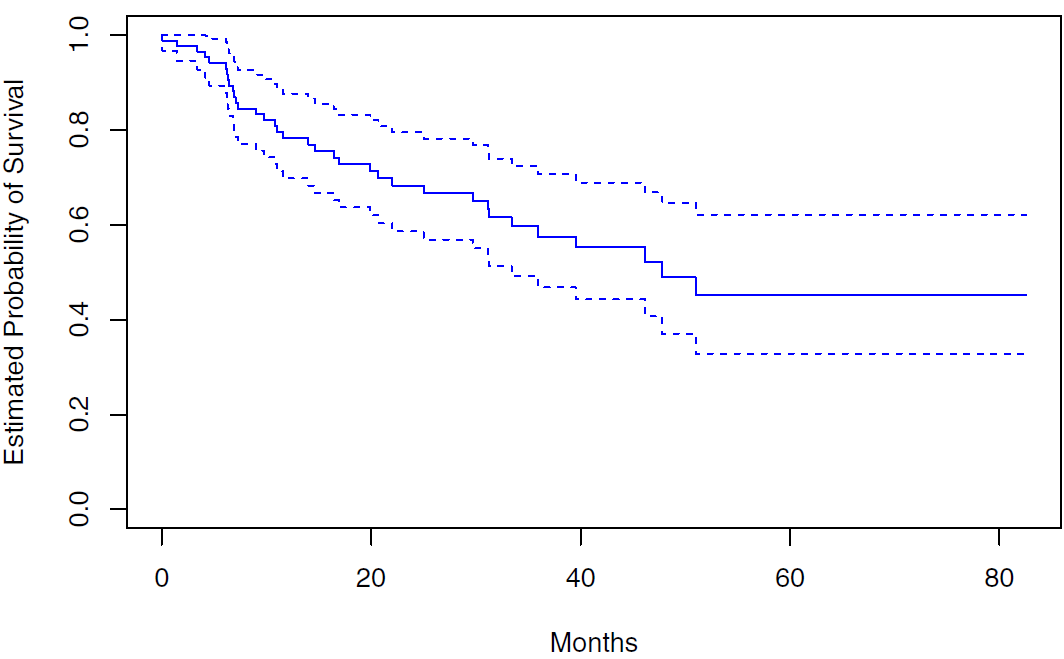
As we can see the the example below, the Kaplan-Meier survival curve has a step-like shape as we assume that \(\hat{S}(t) = \hat{S}(d_k)\) when \(d_k < t < d_{k+1}\).

Based on this new function we can say that the probability of survival past 20 months is \(71\%\).

8.2.3 Interpreting Survival Curve

If select a \(t\) value on the \(x\)-axis we can answer the flowing questions:

  • What is the probability that a breast cancer patient survives longer than 5 years? \(S(5)\)
  • Out of 100 unemployed people, how many do we expect to have a job again after 2 months? \(1 - S(2)\)

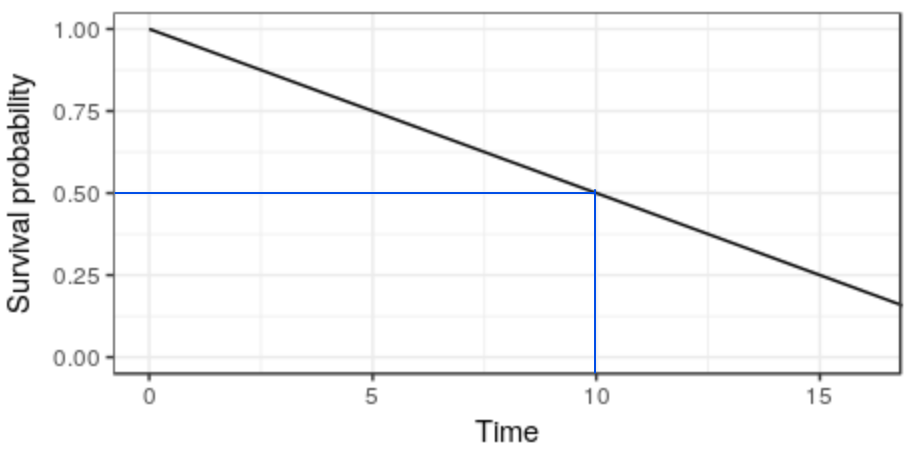
But it also works in the other sense by selecting a quantile on the \(y\)-axis and the checking the related value on the \(x\)-axis, answer

What is the typical waiting time for a cab?

8.2.4 Coding example

library(survival)

BrainCancerSv <- survfit(
  Surv(time, status) ~ 1,
  data = BrainCancer
)

survminer::surv_summary(BrainCancerSv) |>
  subset(select = time:surv) |>
  head()
  time n.risk n.event n.censor      surv
1 0.07     87       1        0 0.9885057
2 1.18     86       0        1 0.9885057
3 1.41     85       1        0 0.9768763
4 1.54     84       0        1 0.9768763
5 2.03     83       0        1 0.9768763
6 3.38     82       1        0 0.9649631
broom::tidy(BrainCancerSv) |>
  base::subset(select = time:estimate) |>
  head()
# A tibble: 6 × 5
   time n.risk n.event n.censor estimate
  <dbl>  <dbl>   <dbl>    <dbl>    <dbl>
1  0.07     87       1        0    0.989
2  1.18     86       0        1    0.989
3  1.41     85       1        0    0.977
4  1.54     84       0        1    0.977
5  2.03     83       0        1    0.977
6  3.38     82       1        0    0.965

We can plot this results using the survminer package:

library(survminer)

ggsurvplot(
  BrainCancerSv,
  palette = "blue",
  surv.median.line = "hv",
  conf.int = FALSE,
  risk.table = "nrisk_cumevents",
  legend = "none",
  break.x.by = 10,
  title = "Brain Cancer Survival Curve"
)

Some additional options to consider:

  • palette: Can be used to define the colors of the curves.
  • linetype: Can be used to define the linetype of the curves.
  • surv.median.line: Can highlight the median survival time.
  • risk.table: Shows a table with the number of subjects at risk of dying.
  • cumevents: Shows a table with the number of events that happened already.
  • cumcensor: Shows a table with the number of censored observations so far.
  • tables.height: Indicate how big the tables should be.

You event can compare to survival curves. To use the same data let’s assume for one curve that we are reporting the event time for all observations.

BrainCancerSvWrong <- survfit(
  Surv(time) ~ 1,
  data = BrainCancer
)

ggsurvplot_combine(
  list(correct = BrainCancerSv, 
       wrong = BrainCancerSvWrong)
)

As results we would unter estimate the probability of survive.

8.3 Weibull Model Survival Curve

The Weibull model can produce a smooth survival curve by using some assumptions about the distribution, but it is very useful when we are adjusting the results based on covariates or making inferences.

8.3.1 Coding example

# Defining the probabilities to plot

SurvivalProb <- seq(.99, .01, by = -.01)

plot(SurvivalProb)

# Fitting the distribution

BrainCancerWSC <- survreg(
  Surv(time, status) ~ 1,
  data = BrainCancer,
  dist = "weibull"
)


# Predicting times

BrainCancerWmTime <- predict(
  BrainCancerWSC,
  type = "quantile",
  p = 1 - SurvivalProb,
  newdata = data.frame(1)
)


# Create a data.frame an plot the results

data.frame(
  time = BrainCancerWmTime,
  surv = SurvivalProb, 
  upper = NA,
  lower = NA,
  std.err = NA
) |>
  ggsurvplot_df(surv.geom = geom_line)

8.4 Log-Rank Test

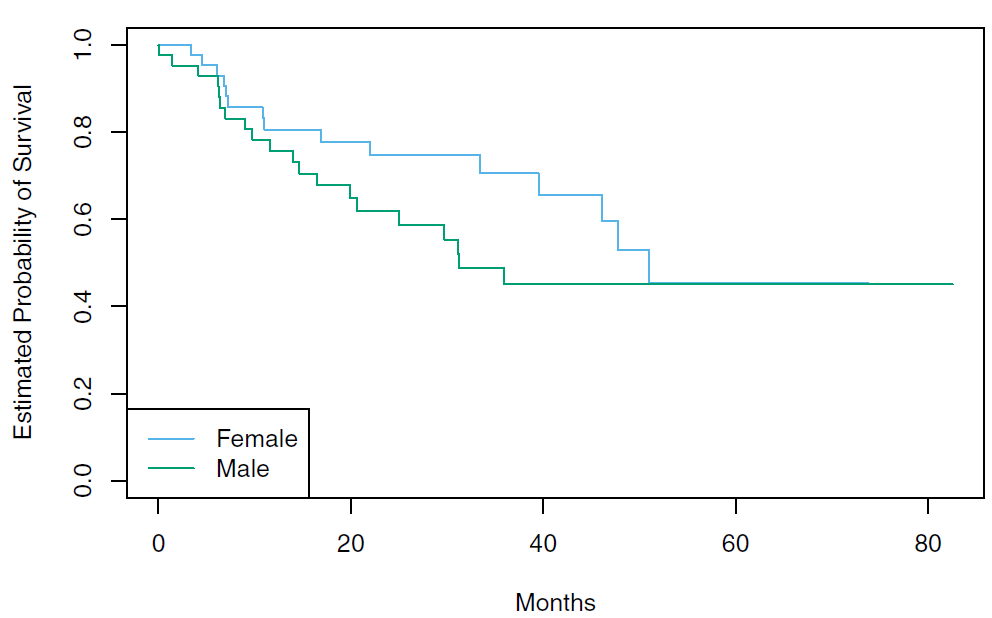
If we want to explore whether the sex is an important factor to impact the survival curve we can create a plot comparing the curve of each sex.

Females seem to fare a little better up to about 50 months, but then the two curves both level off to about 50%. To take a better decision we need to confirm if this difference was produced by chance or if it was statistical significant.

As our target variable time mixes event and censoring times we need to use a particular statistical test known as log-rank test, Mantel-Haenszel test or Cochran-Mantel-Haenszel test. In this test we need to split some the variables used in the Kaplan-Meier survival curve.

\[ \begin{split} r_{1k} + r_{2k} & = r_k \\ q_{1k} + q_{2k} & = q_k \end{split} \]

In order to test \(H_0 : \text{E}(X) = 0\) for some random variable \(X\), one approach is to construct a test statistic of the form

\[ W = \frac{X - \text{E}(X)}{\sqrt{\text{Var}(X)}} \]

Where:

\[ \begin{split} X & = \sum_{k=1}^K q_{1k} \\ \text{E}(q_{1k}) & = \frac{r_{1k}}{r_k} q_k \\ \text{Var}\left( X \right) \approx \sum_{k=1}^K \text{Var} (q_{1k}) & = \sum_{k=1}^K \frac{q_k(r_{1k}/r_k) (1-r_{1k}/r_k) (r_k-q_k)}{r_k-1} \end{split} \]

As result

\[ \begin{split} W & = \frac{\sum_{k=1}^K(q_{1k}-\text{E}(q_{1k}))} {\sqrt{\sum_{k=1}^K \text{Var} (q_{1k})}} \\ & = \frac{\sum_{k=1}^K(q_{1k}- \frac{r_{1k}}{r_k} q_k)} {\sqrt{\sum_{k=1}^K \frac{q_k(r_{1k}/r_k) (1-r_{1k}/r_k) (r_k-q_k)}{r_k-1}}} \end{split} \]

When the sample size is large, the log-rank test statistic \(W\) has approximately a standard normal distribution and can be used to compute a p-value for the null hypothesis that there is no difference between the survival curves in the two groups.

For the ISLR2::BrainCancerthe p-value is 0.2 using the theoretical null distribution. Thus, we cannot reject the null hypothesis of no difference in survival curves between females and males.

8.5 Regression Models With a Survival Response

Fitting a linear regression to a censored data can be challenging as we want to predict \(T\) rather than \(Y\) and to overcome this difficulty need to use a sequential construction.

8.5.1 Hazard Function

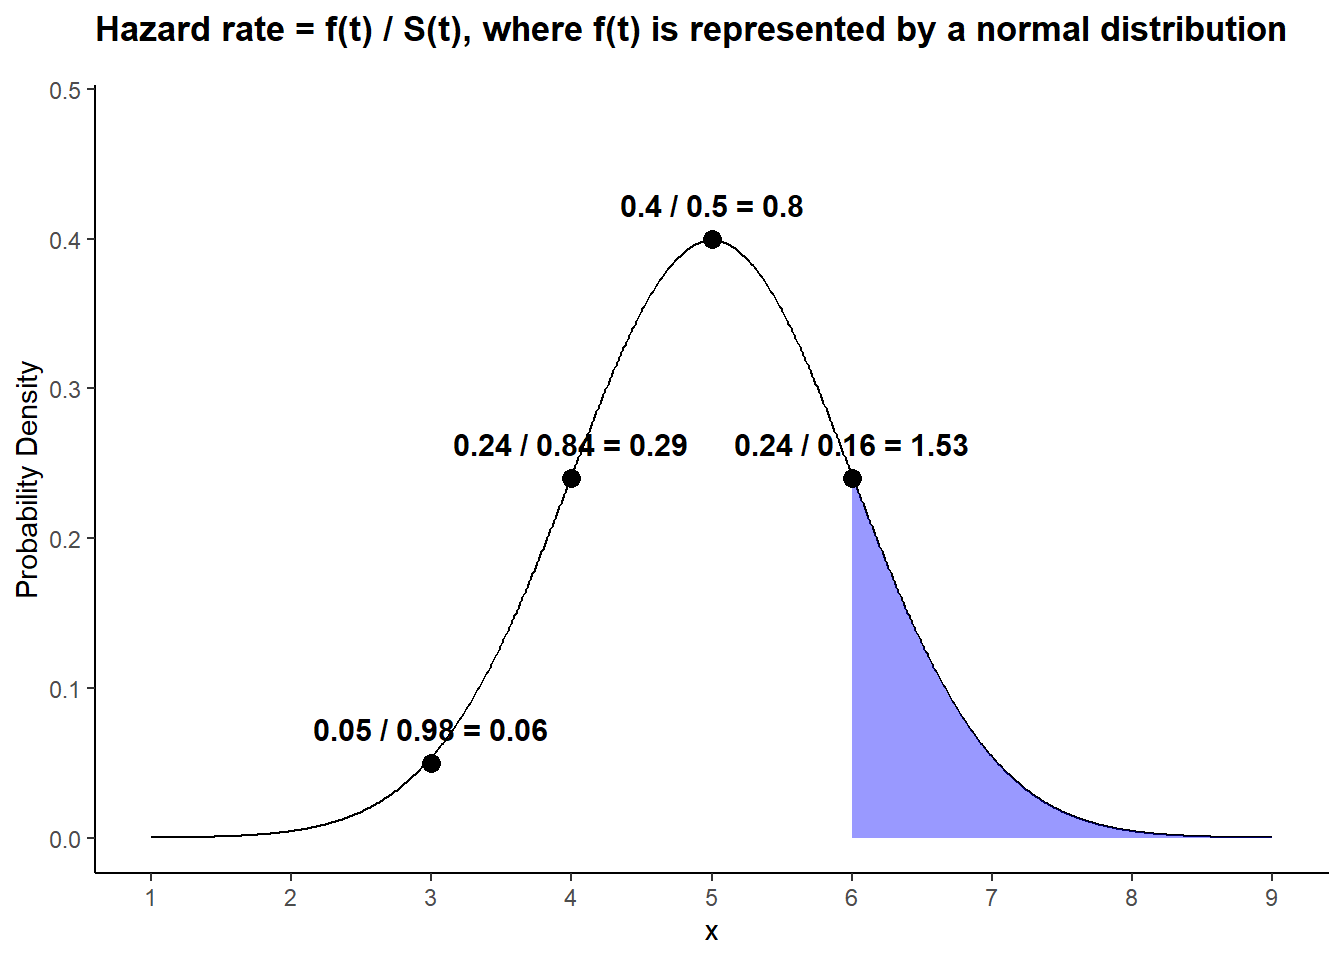
The hazard function also known as hazard rate or force of mortality is useful to estimate the risk of an event and measures the instantaneous rate (conditional probability/unit of time) at which events occur given that the event has not yet occurred for the subjects under study.

\[ h(t) = \lim_{\Delta t \rightarrow 0} \frac{\Pr(t < T \leq t + \Delta t| T > t)}{\Delta t} \]

Where:

  • \(T\): It is the (unobserved) survival time.
  • \(\Delta t\): It’s an extremely tiny number.

It has a close relational with the probability density function of \(T\) which shows how common or rare is any particular \(T\) value is likely to be:

\[ f(t) = \lim_{\Delta t \rightarrow 0} \frac{\Pr(t < T \leq t + \Delta t)}{\Delta t} \]

Using the conditional probability definition we can find how the hazard function connect the probability density function and the survival function.

\[ \begin{split} h(t) & = \lim_{\Delta t \rightarrow 0} \frac{\Pr((t < T \leq t + \Delta t) \cap (T > t)) / \Pr(T > t)}{\Delta t} \\ h(t) & = \lim_{\Delta t \rightarrow 0} \frac{\Pr(t < T \leq t + \Delta t) / \Delta t }{\Pr(T > t)} \\ h(t) & = \frac{f(t)}{S(t)} \end{split} \]

But also

\[ \frac{\mathrm d}{\mathrm d x} S(t) = -f(t) \]

Let’s see a simulated example:

Code
# Setup
library(ggplot2)
mu <- 5
sigma <- 1
t <- 3:6

# Create a data frame of values around the mean
df <- data.frame(x = seq(mu-4*sigma, mu+4*sigma, length=1000))
df$Density <- dnorm(df$x, mean=mu, sd=sigma)
df$S <- pnorm(df$x, mean=mu, sd=sigma, lower.tail = FALSE)

# Define hazard points to estimate
annotations <-data.frame(
  t,
  density = dnorm(t, mean=mu, sd=sigma) |> round(2),
  survival = pnorm(t, mean=mu, sd=sigma, lower.tail = FALSE) |> round(2),
  hazard = 
    (dnorm(t, mean=mu, sd=sigma) /
       pnorm(t, mean=mu, sd=sigma, lower.tail = FALSE)) |>
    round(2)
)

annotations$label <- paste0(
  annotations$density," / ",
  annotations$survival," = ", 
  annotations$hazard
)

# Plot the normal distribution
ggplot(df, aes(x=x, y=Density)) + 
  geom_blank(aes(y = Density*1.2)) +
  geom_line() +
  geom_area(data= subset(df, x > max(t)),
            fill="blue", 
            alpha = 0.4) +
  geom_point(data = annotations,
             aes(x = t, y = density),
             size = 3) +
  geom_text(data = annotations,
            aes(x = t, y = density, label = label),
            vjust = -1,
            fontface = "bold",
            size = 4) +
  labs(x="x", 
       y="Probability Density",
       title = "Hazard rate = f(t) / S(t), where f(t) is represented by a normal distribution") +
  scale_x_continuous(breaks = scales::breaks_width(1)) +
  theme_classic()+
  theme(plot.title = element_text(face = "bold", 
                                  margin = margin(b = 0.5, unit = "cm")))

8.5.2 Modeling the survival time

As we often want to know how a treatment or the severity of an illness affects the survival of the patients.

Lineal approach

To use the hazard function to model the survival time as a function of the covariates (predictors), we can assume the next form for the hazard function to assure positive results:

\[ h(t|x_i) = \exp \left( \beta_0 + \sum_{j=1}^p \beta_j x_{ij} \right) \]

Based on \(h(t|x_i)\) we can calculate \(S(t|x_i)\) and maximize the next likelihood function to estimate the parameters \(\beta\) assuming that the \(n\) observations are independent

\[ L = \prod_{i=1}^n h(y_i)^{\delta_i} S(y_i) \]

  • When the \(i\)th observation is not censored (\(\delta = 1\)) the likelihood is the probability of dying \(f(y_i)\) in a tiny interval around time \(y_i\).
  • When the \(i\)th observation is censored(\(\delta = 0\)) the likelihood is the probability of surviving \(S(y_i)\) at least until time \(y_i\).

Flexible approach

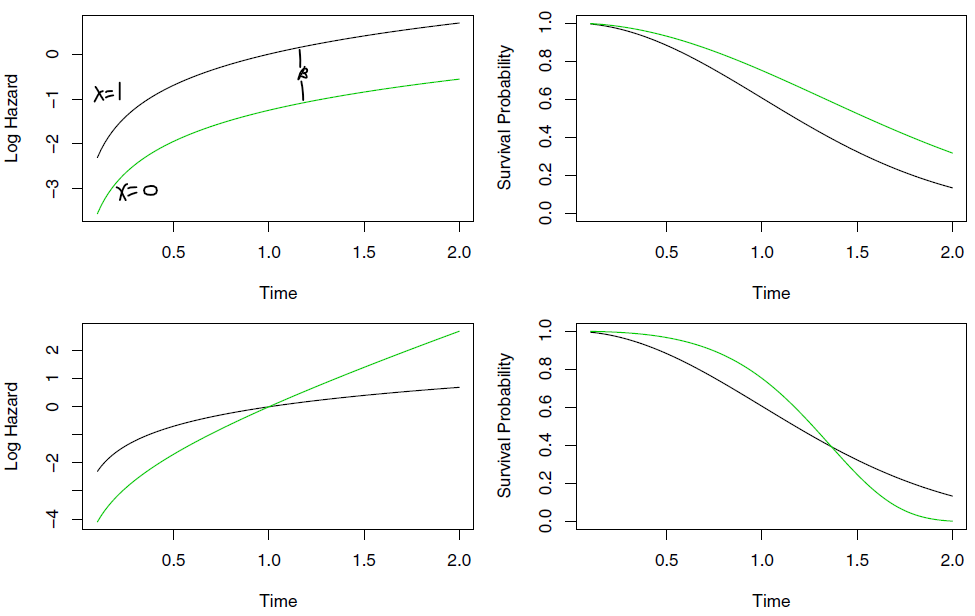
To use the hazard function to model the survival time as a function of the covariates (predictors), we can use the proportional hazards assumption

\[ h(t|x_i) = \underbrace{h_0(t)}_\text{Baseline Hazard} \underbrace{\exp \left( \sum_{j=1}^p x_{ij} \beta_j \right)}_\text{Relative Risk} \] Where

  • Baseline Hazard \(h_0(t) \geq 0\): Represent an unspecified function, so it can take any form.

The most import assumption to keep in main is that a one-unit increase in \(x_{ij}\) corresponds to an increase in \(h(t|x_i)\) by a factor of \(\exp(\beta_j)\).

But with the proportional hazards assumption we can not estimate \(\beta = (\beta_1, \dots, \beta_p)^T\) by maximizing the likelihood with out having an specify the form of \(h_0(t)\).

To solve this problem the Cox’s proportional hazards model make use of the same sequential in time logic that we used to derive the Kaplan-Meier survival curve and the log-rank test.

We know that if the \(i\)th observation is uncensored, then \(h(t|x_i) = h_0(y_i)\exp \left( \sum_{j=1}^p x_{ij} \beta_j \right)\), but the total hazard at time \(y_i\) for the at risk observations \(\sum_{i': y_{i'} \geq y_i} h_0(y_i) \exp \left( \sum_{j=1}^p x_{i'j} \beta_j \right)\) making possible to cancel out \(h_0(y_i)\) at calculating the probability that the \(i\)th observation is the one to fail at time \(y_i\):

\[ \frac{h_0(y_i)\exp \left( \sum_{j=1}^p x_{ij} \beta_j \right)} {\sum_{i': y_{i'} \geq y_i} h_0(y_i) \exp \left( \sum_{j=1}^p x_{i'j} \beta_j \right)} \]

The partial likelihood correspond to the product of these probabilities over all of the uncensored observations and we can used to estimate \(\beta\). If there are no tied failure times it takes the form:

\[ PL(\beta) = \prod_{i: \delta_i = 1} \frac{\exp \left( \sum_{j=1}^p x_{ij} \beta_j \right)} {\sum_{i': y_{i'} \geq y_i}\exp \left( \sum_{j=1}^p x_{i'j} \beta_j \right)} \]

Connection With The Log-Rank Test

In the case of a single binary covariate, the score test for \(H_0 : \beta = 0\) in Cox’s proportional hazards model is exactly equal to the log-rank test.

Examples
Brain Cancer Data

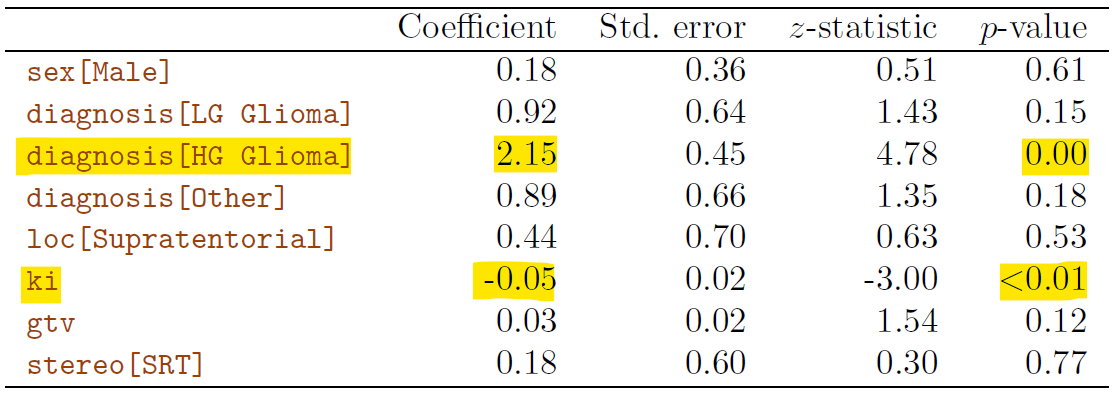
  • The estimated hazard for patients with HG Glioma is \(e^{2.15} = 8.58\) times greater that patients with different diagnosis if we hold all other covariates fixed.

  • The higher the Karnofsky index, the lower the chance of dying at any given point in time, to be more specific each one-unit increase in the Karnofsky index corresponds to a multiplier of \(e^{−0.05} = 0.95\) in the instantaneous chance of dying.

Publication Data
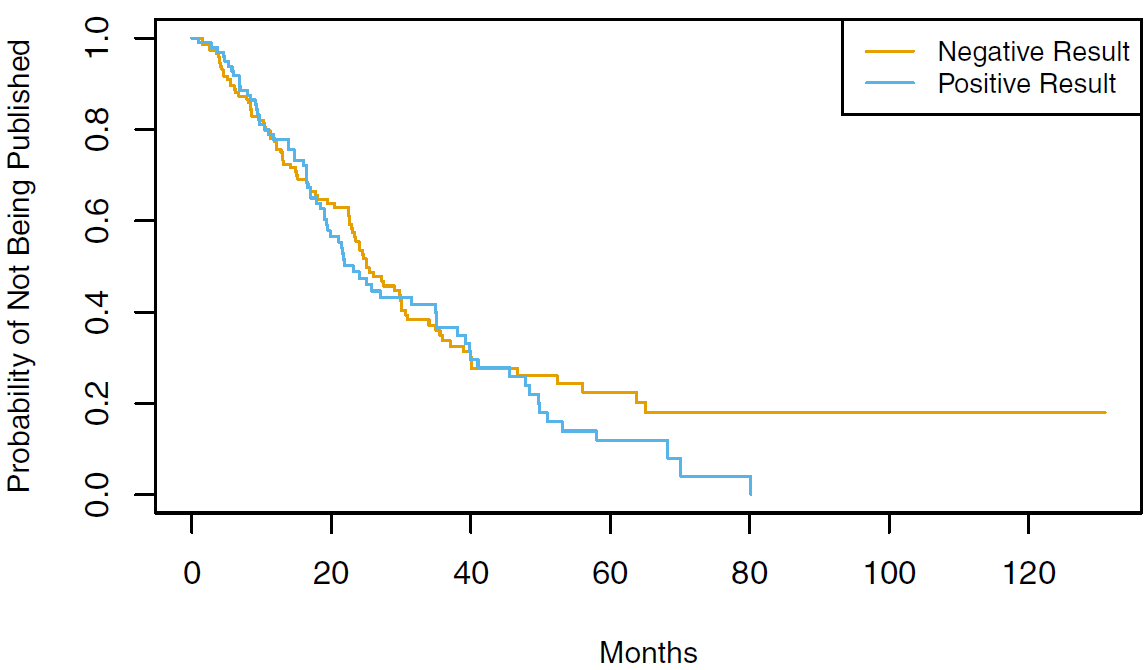
  • They start running a log-rank test yields a very unimpressive \(p\)-value of \(0.36\) based on posres.

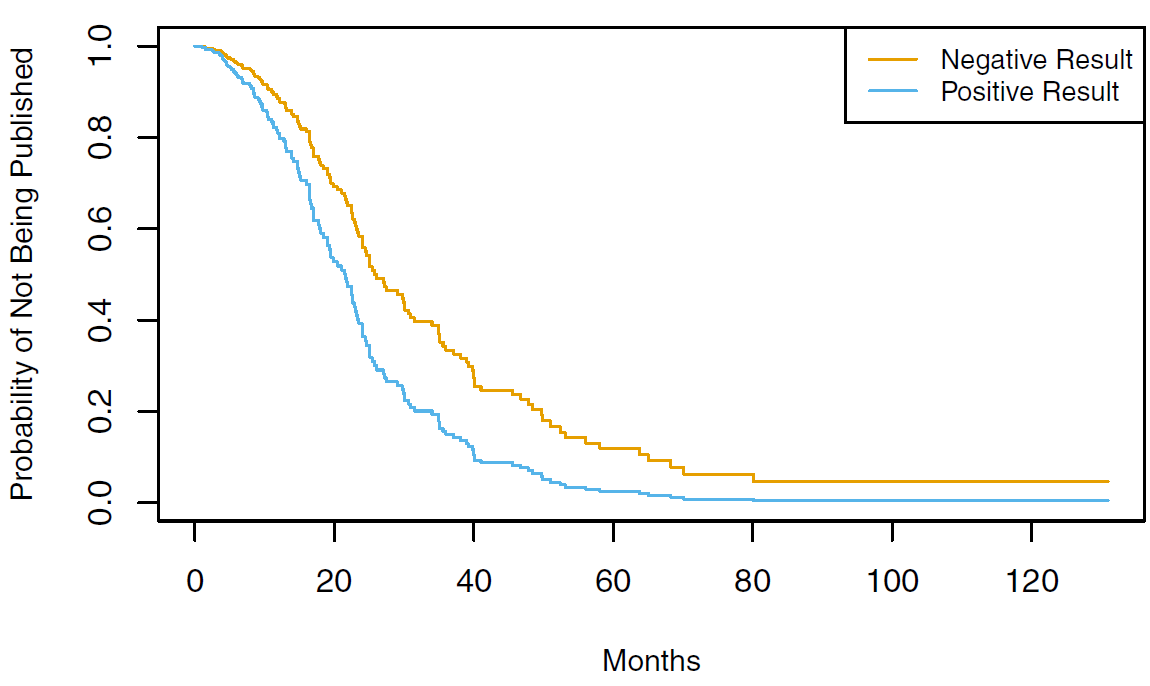
  • Then the run a Cox model with all the predictors the posres turn to be a great predictor of the time to publication. Here we can see the KM survival curve after adjusting for all other covariates.

Coding example
# Training Cox Models
BrainCancerCox <- coxph(
  Surv(time, status) ~ diagnosis + ki,
  data = BrainCancer
)

coef(BrainCancerCox)
diagnosisLG glioma diagnosisHG glioma     diagnosisOther                 ki 
        1.04869491         2.24981734         0.86153649        -0.06585647 
# Defining the relations to plot
BrainCancerGrid <- expand.grid(
  diagnosis = levels(BrainCancer$diagnosis),
  ki = quantile(BrainCancer$ki, probs = c(0.50, 0.75))
)

# Compute Cox model and survival curves
BrainCancerCoxSc <- survfit(
  BrainCancerCox,
  data = BrainCancer,
  newdata = BrainCancerGrid,
  conf.type = "none"
)

# Use the summary of BrainCancerCoxSc
# to take a vector of patient IDs
BrainCancerCoxScDf <- surv_summary(BrainCancerCoxSc)
pid <- as.character(BrainCancerCoxScDf$strata)


# Transforming the data to create the plot
m_newdat <- BrainCancerGrid[pid, , drop = FALSE]
BrainCancerCoxScDfPlot <- cbind(BrainCancerCoxScDf, m_newdat)
BrainCancerCoxScDfPlot$ki <- factor(BrainCancerCoxScDfPlot$ki)


# Plot
ggsurvplot_df(
  BrainCancerCoxScDfPlot, 
  linetype = "ki",
  color = "diagnosis", 
  legend.title = NULL, 
  censor = FALSE
)

Weibull model

This method start assuming a distribution to describe the event time, from the following distributions.

names(survreg.distributions)
 [1] "extreme"     "logistic"    "gaussian"    "weibull"     "exponential"
 [6] "rayleigh"    "loggaussian" "lognormal"   "loglogistic" "t"          

In this model the coefficients are interpreted in the opposite way to the Cox’s Model as positive coefficients increase time until the event take place.

BrainCancerWM <- survreg(
  Surv(time, status) ~ diagnosis + ki,
  data = BrainCancer,
  dist = "weibull"
)

coef(BrainCancerWM)
       (Intercept) diagnosisLG glioma diagnosisHG glioma     diagnosisOther 
        0.61306348        -0.85014728        -1.94279137        -0.82320374 
                ki 
        0.05407582 

One technique to visualize numeric variables in using the 25%, 50%, and 75-% quantiles

# Defining the probabilities to plot

SurvivalProb <- seq(.99, .01, by = -.01)

plot(SurvivalProb)

# Defining the relations to plot

BrainCancerGrid <- CJ(
  diagnosis = levels(BrainCancer$diagnosis),
  ki = quantile(BrainCancer$ki, probs = c(0.50, 0.75))
)

BrainCancerGrid
    diagnosis ki
1:  HG glioma 80
2:  HG glioma 90
3:  LG glioma 80
4:  LG glioma 90
5: Meningioma 80
6: Meningioma 90
7:      Other 80
8:      Other 90
# The predict function creates column per observation in newdata

BrainCancerWmTime <- predict(
  BrainCancerWM,
  type = "quantile",
  p = 1 - SurvivalProb,
  newdata = BrainCancerGrid
)


# Join and pivot longer the variables in order the have
# the columns names to run the plotting function

cbind(BrainCancerGrid,
      BrainCancerWmTime
)[, melt(.SD,
         id.vars = names(BrainCancerGrid),
         variable.name = "surv_id",
         value.name = "time")
][,`:=`(surv = SurvivalProb[as.integer(surv_id)],
        ki = factor(ki))
][, c("upper", "lower", "std.err", "strata") := NA_real_] |>
  ggsurvplot_df(surv.geom = geom_line,
                linetype = "ki", 
                color = "diagnosis", 
                legend.title = NULL)

8.5.3 Shrinkage for the Cox Model

To implement the “loss+penalty” formulation to our partial likelihood we use the next function:

\[ - \log \left( \prod_{i: \delta_i = 1} \frac{\exp \left( \sum_{j=1}^p x_{ij} \beta_j \right)} {\sum_{i': y_{i'} \geq y_i}\exp \left( \sum_{j=1}^p x_{i'j} \beta_j \right)} \right) + \lambda P(\beta) \]

Where:

  • \(\beta = \beta_1, \dots, \beta_p\)
  • \(\lambda\): Correspond to a non-negative tunning parameter
  • \(P(\beta) = \sum_{j=1}^p \beta_j^2\) ridge penalty
  • \(P(\beta) = \sum_{j=1}^p |\beta_j|\) lasso penalty

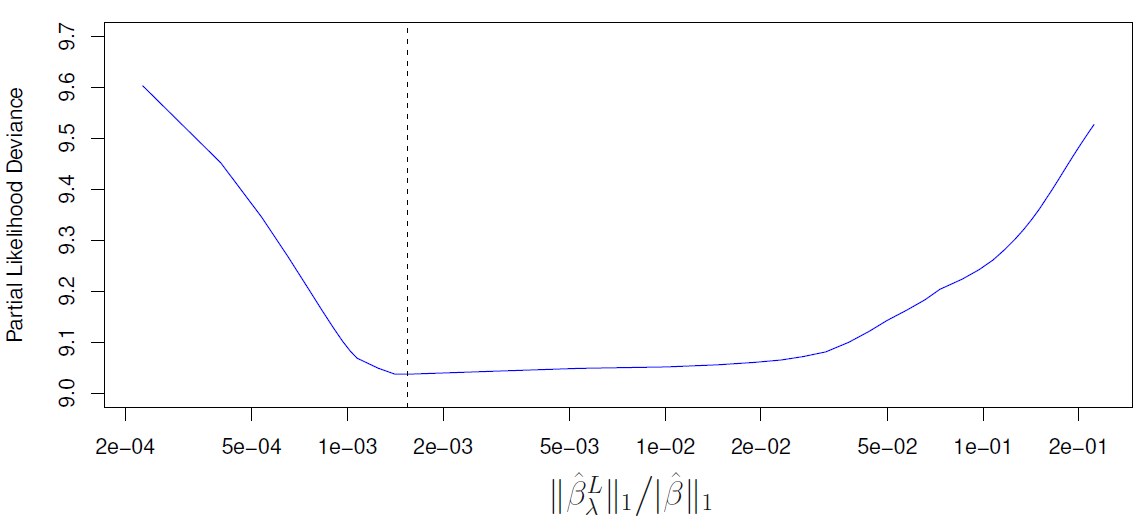
Let’s see an example of the tuning process for a lasso-penalized Cox model:

8.5.4 Model Evaluation

Comparing predicted and true survival times

To compare the predicted and the true survival time, we need to figure out how to:

  1. Use censored observations.
  2. Translate the estimated survival curve \(S(t|x)\) into survival times.

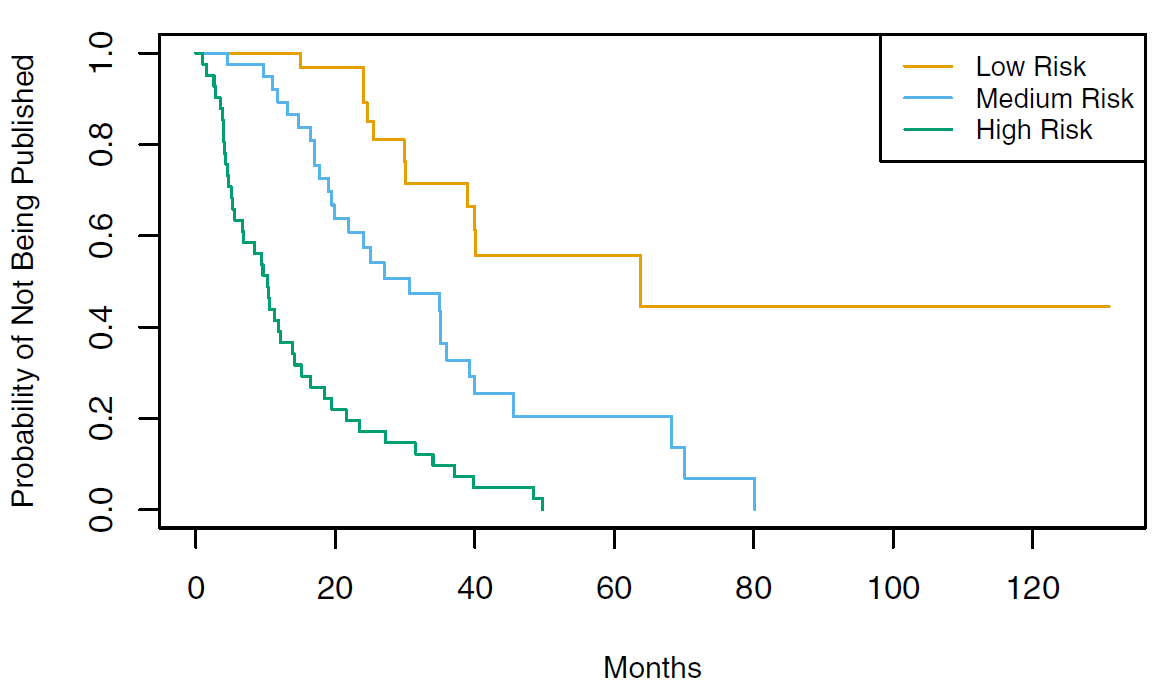
One possible solution is to stratify the observations based on the coefficient estimated by following the next steps:

  1. Calculate an estimated risk score using the coefficients from the Cox’s model on test dataset.

\[ \hat{\eta}_i = \hat{\beta}_1 x_{i1} + \dots + \hat{\beta}_p x_{ip} \]

  1. Categorize the observations based on their “risk”. If the model works well you should see a clear separation between each class.

C-index

I would be useful to calculate a metric like the AUC from the ROC curve, but it’s important to recall that we do not observe the event time of each observation \(t_1, \dots, t_n\).

According to Longato, Vettoretti, and Di Camillo (2020) an alternative is to use the Harrell’s concordance index (C-index) which quantify the probability that greater risk scores are attributed to subjects with higher change of experiencing the event.

\[ C = P(\hat{\eta}_{i'} > \hat{\eta}_i \; | \; T_{i'} < T_i, \; \delta_{i'} = 1, \; T_{i'} < t) \]

With the next function:

\[ C = \frac{\sum_{i,i':y_i>y_{i'}} I(\hat{\eta}_{i'} > \hat{\eta}_{i}) \delta_{i'}}{\sum_{i,i':y_i>y_{i'}} \delta_{i'}} \]

Where:

  • \(y_i\) and \(y_{i'}\) are the observed survival times.
  • \(\hat{\eta}_i\) and \(\hat{\eta}_{i'}\) are the estimated risk scores
  • \(I(\hat{\eta}_{i'} > \hat{\eta}_i)\) returns 1 if the criteria is met.
  • \(\delta_{i'}\) returns 1 if the \(i'^{th}\) subject’s event has been observed.
Simulated example

Where \(P = 1\) and \(\hat{\beta} = 2.5\) and we have the next testing set:

Subject x Survival Time \(y\) Censoring Indicator \(\delta\)
1 1 3 0
2 2 4 1
3 3 5 1
4 4 6 1
5 5 7 0
  1. Calculate the risk scores \(\hat{\eta}\) for each subject:

\(\hat{\eta}_i = \hat{\beta} x_i\)

Subject \(\hat{\eta}\)
1 2.5
2 5
3 7.5
4 10
5 12.5
  1. For each pair of subjects (\(i, i'\)) where \(y_i > y_{i'}\), calculate \(I(\hat{\eta}_{i'} > \hat{\eta}_i) \delta_{i'}\) and \(\delta_{i'}\):
Pair (i, i’) \(y_i > y_{i'}\) \(I(\hat{\eta}_{i'} > \hat{\eta}_i)\) \(\delta_{i'}\) \(I(\hat{\eta}_{i'} > \hat{\eta}_i) \delta_{i'}\)
(2,1) True 0 0 0
(3,1) True 0 0 0
(3,2) True 0 1 0
(4,1) True 0 0 0
(4,2) True 0 1 0
(4,3) True 0 1 0
(5,1) True 0 0 0
(5,2) True 0 1 0
(5,3) True 0 1 0
(5,4) True 0 1 0
  1. Calculate the concordance index C:

\[ C = \frac{\sum_{i,i':y_i>y_{i'}} I(\hat{\eta}_{i'} > \hat{\eta}_{i}) \delta_{i'}}{\sum_{i,i':y_i>y_{i'}} \delta_{i'}} = \frac{0}{5} = 0 \]

Coding example
library(dynpred)

data.frame(
  predictors = c("diagnosis" ,"diagnosis + ki", "."),
  c_index = c(
    CVcindex(Surv(time, status) ~ diagnosis, data = BrainCancer)[["cindex"]],
    CVcindex(Surv(time, status) ~ diagnosis + ki, data = BrainCancer)[["cindex"]],
    CVcindex(Surv(time, status) ~ ., data = BrainCancer)[["cindex"]]
  )
)
1/872/873/874/875/876/877/878/879/8710/8711/8712/8713/8714/8715/8716/8717/8718/8719/8720/8721/8722/8723/8724/8725/8726/8727/8728/8729/8730/8731/8732/8733/8734/8735/8736/8737/8738/8739/8740/8741/8742/8743/8744/8745/8746/8747/8748/8749/8750/8751/8752/8753/8754/8755/8756/8757/8758/8759/8760/8761/8762/8763/8764/8765/8766/8767/8768/8769/8770/8771/8772/8773/8774/8775/8776/8777/8778/8779/8780/8781/8782/8783/8784/8785/8786/8787/87

1/872/873/874/875/876/877/878/879/8710/8711/8712/8713/8714/8715/8716/8717/8718/8719/8720/8721/8722/8723/8724/8725/8726/8727/8728/8729/8730/8731/8732/8733/8734/8735/8736/8737/8738/8739/8740/8741/8742/8743/8744/8745/8746/8747/8748/8749/8750/8751/8752/8753/8754/8755/8756/8757/8758/8759/8760/8761/8762/8763/8764/8765/8766/8767/8768/8769/8770/8771/8772/8773/8774/8775/8776/8777/8778/8779/8780/8781/8782/8783/8784/8785/8786/8787/87

1/872/873/874/875/876/877/878/879/8710/8711/8712/8713/8714/8715/8716/8717/8718/8719/8720/8721/8722/8723/8724/8725/8726/8727/8728/8729/8730/8731/8732/8733/8734/8735/8736/8737/8738/8739/8740/8741/8742/8743/8744/8745/8746/8747/8748/8749/8750/8751/8752/8753/8754/8755/8756/8757/8758/8759/8760/8761/8762/8763/8764/8765/8766/8767/8768/8769/8770/8771/8772/8773/8774/8775/8776/8777/8778/8779/8780/8781/8782/8783/8784/8785/8786/8787/87
      predictors   c_index
1      diagnosis 0.5883878
2 diagnosis + ki 0.7376879
3              . 0.7501296

8.6 References

Longato, Enrico, Martina Vettoretti, and Barbara Di Camillo. 2020. “A Practical Perspective on the Concordance Index for the Evaluation and Selection of Prognostic Time-to-Event Models.” Journal of Biomedical Informatics 108: 103496. https://doi.org/https://doi.org/10.1016/j.jbi.2020.103496.