🚕 How an Uber driver can earn an extra $2,000 per month without working more hours
Executive Summary
🚨 The Problem
NYC taxi and rideshare drivers work long, exhausting shifts, but most are leaving money on the table. Without a clear strategy, they accept nearly every trip that comes their way—wasting precious time on low-value rides that drag down their hourly wage.
🎯 The Business Goal
Increase average taxi driver earnings by 20%—without working more hours.
📍 Project Scope
We focused on high-volume for-hire vehicles (Uber, Lyft, Juno, Via) operating within Manhattan, Brooklyn, and Queens—the busiest boroughs in NYC.
💡 The Solution
We built a data‑driven decision system that answers two simple but powerful questions:
🤔 Which trips should I accept? – A machine learning model (XGBoost) classifies each trip as high‑value or low‑value in real time. The winning strategy? Our model recommends accepting only trips that have a 90%+ chance of being among the top 25% most profitable in the next few minutes. This alone adds +$8/hour.
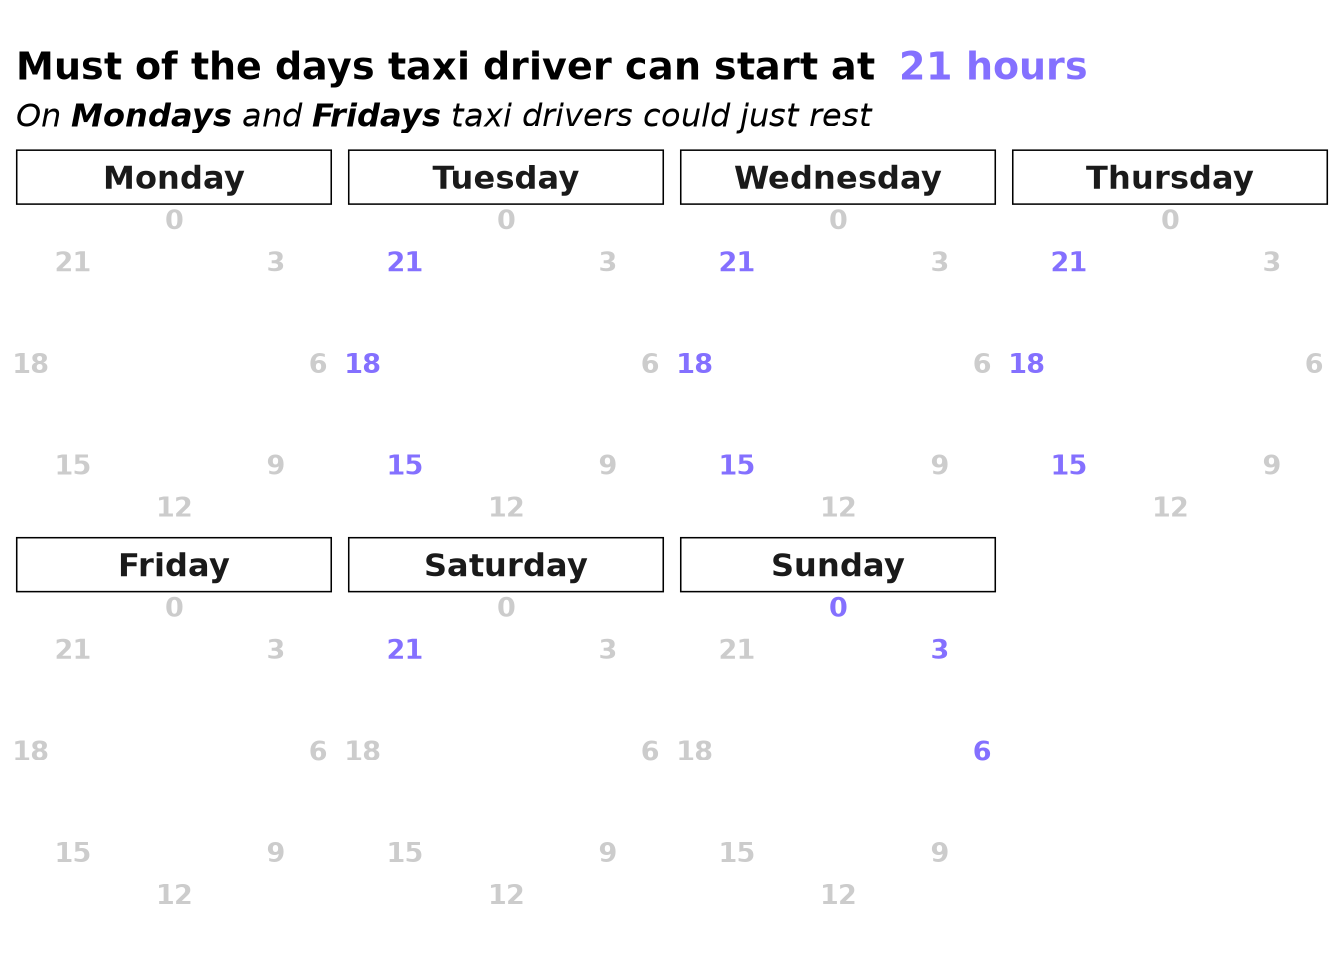
⏰ When and with whom should I start my shift? – Through simulation, we discovered that the starting zone barely matters, but choosing Uber over Lyft and working night shifts adds up another +$6 per hour.
Combine both strategies → +$14/hour → 25% more earnings → $2,200 extra per month 💸
No extra hours. No extra effort. Just smarter decisions. ✨
🏆 Results Highlight
🚀 25.4% Earnings Increase
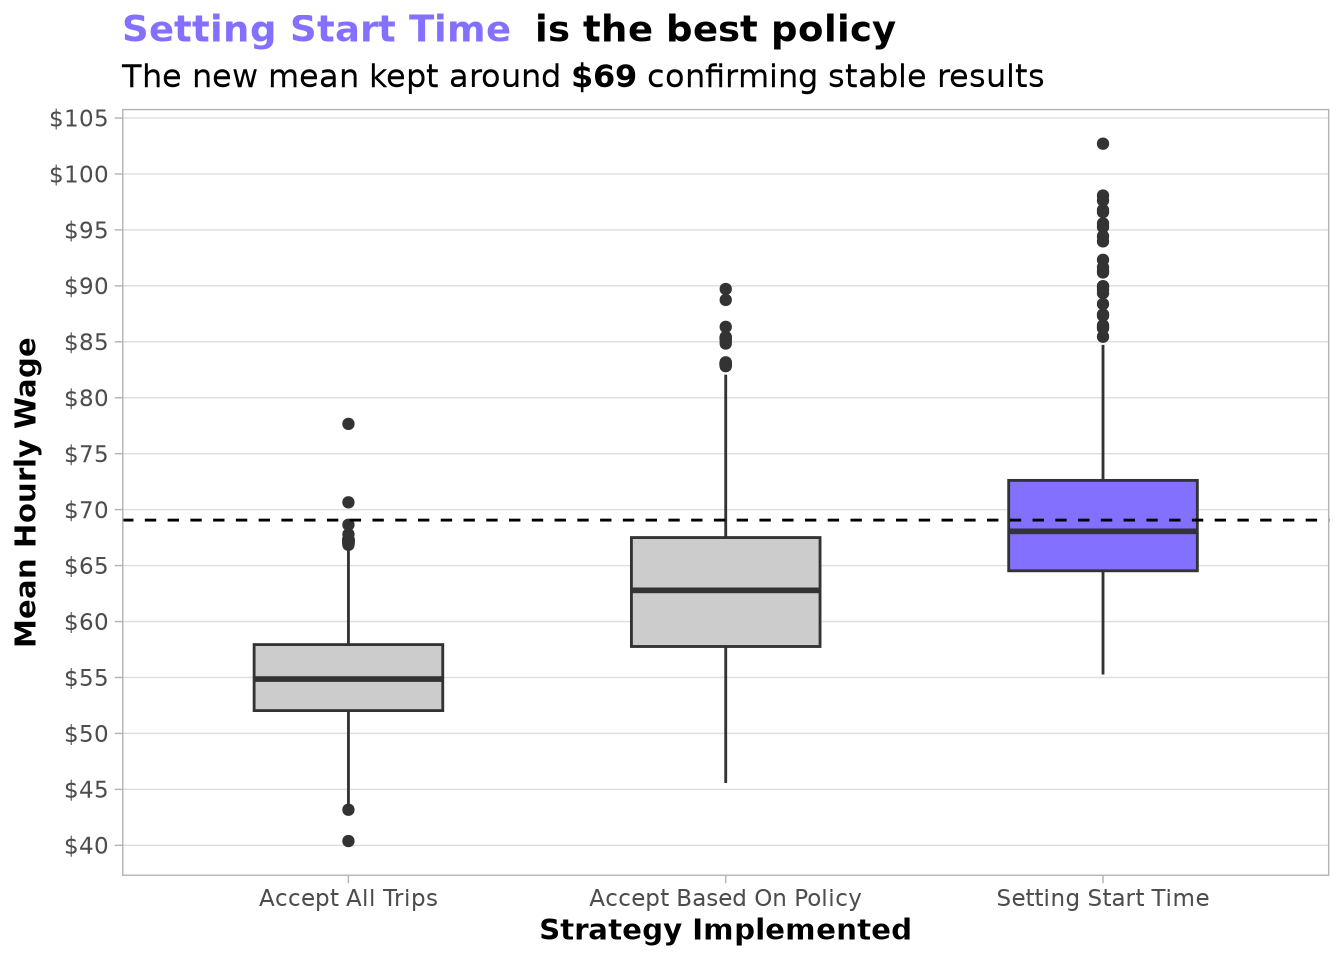
Drivers implementing our full strategy saw their average hourly wage rise from $55.09 to $69.07—significantly exceeding the 20% target.
💰 Over $2,100 More Per Month
Working 8-hour days, 5 days a week, this improvement translates to roughly $2,200 in additional monthly earnings for a full-time driver.
🔒 Proven for the Real World
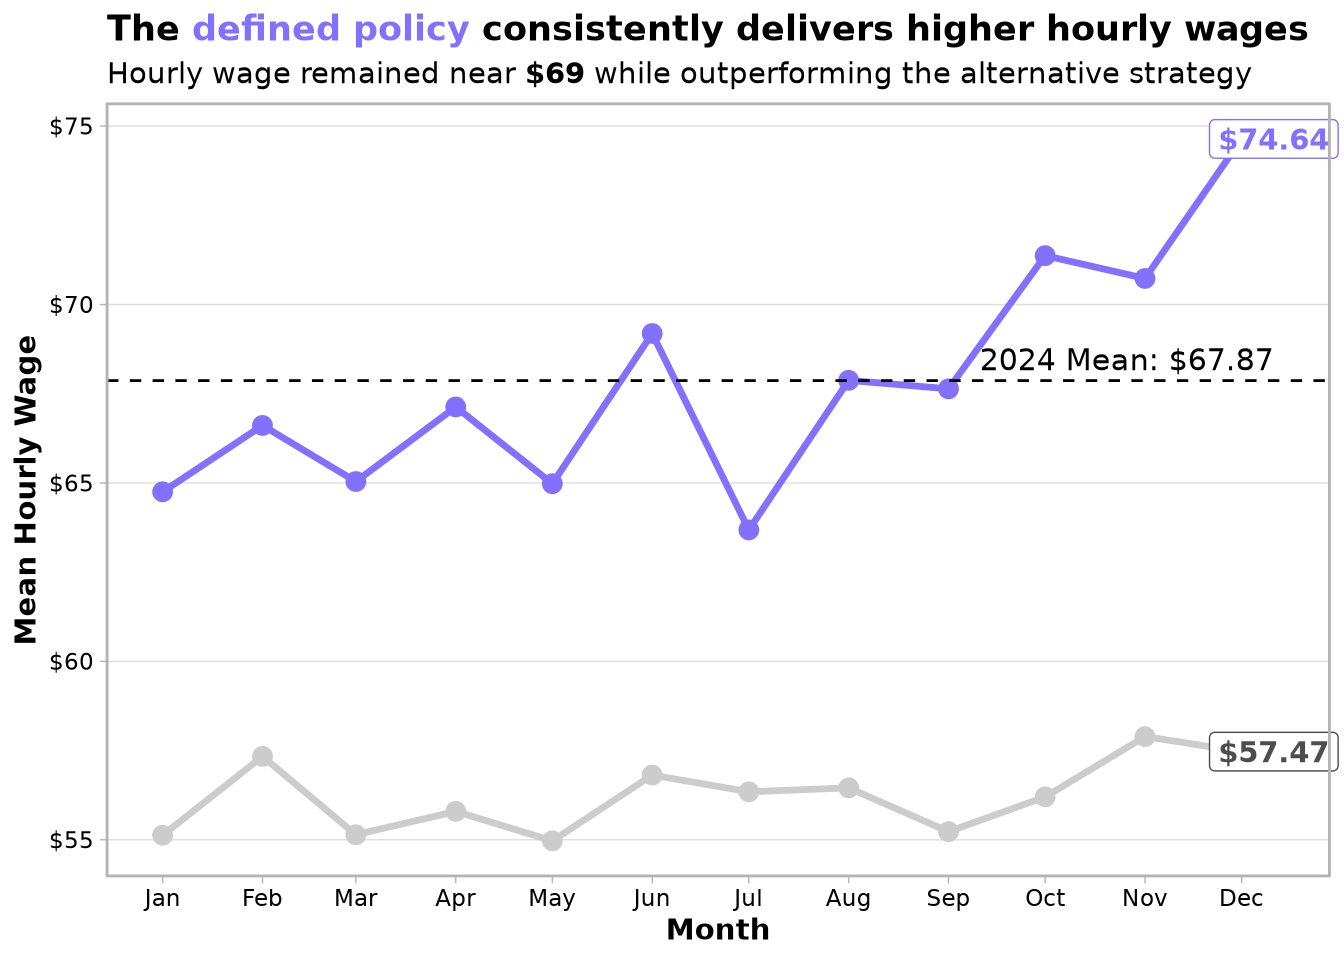
The true test came when we validated our policy on 2024 data—a year the models were not trained on. The performance held strong, with the policy achieving an average hourly wage of $67.87. More importantly, it consistently outperformed the baseline in every single month, maintaining a solid advantage of $7–$17 per hour. This confirms the strategy is reliable and adaptable to changing conditions.
🔑 Key Insights We Discovered
Our recommendations are practical and implementable:
- 🚗 Drive for Uber if possible
- 🌙 Work nights rather than mornings
- ❌ Reject trips that fall below our profitability threshold
- 📅 Avoid Mondays and Fridays if you have the flexibility
- 🗺️ Where you start doesn’t matter as much as when you start
💡 Why This Work Is Impressive
- We Simulated Over 65,000 Workdays
Without actual driver IDs in the data (anonymized trip records), we built a simulation engine that modeled driver behavior across tens of thousands of scenarios—effectively “playing out” entire days to test what strategies would work best in the real world.
We Combined Data Science with Decision Theory
- Machine learning (XGBoost) to classify trip quality
- Sequential decision modeling to simulate day-long driver behavior
- Spatial analysis of NYC neighborhoods
- Demographic data from the US Census to understand local patterns
We Processed Massive Datasets
Working with over 55 GB of NYC taxi trip data, we used modern data engineering techniques (DuckDB, parallel processing, caching) to make this analysis feasible.
- All Results Are Reproducible
The entire analysis is documented, unit-tested, and containerized. Every step—from data collection to model evaluation—can be reproduced by anyone with the right tools.
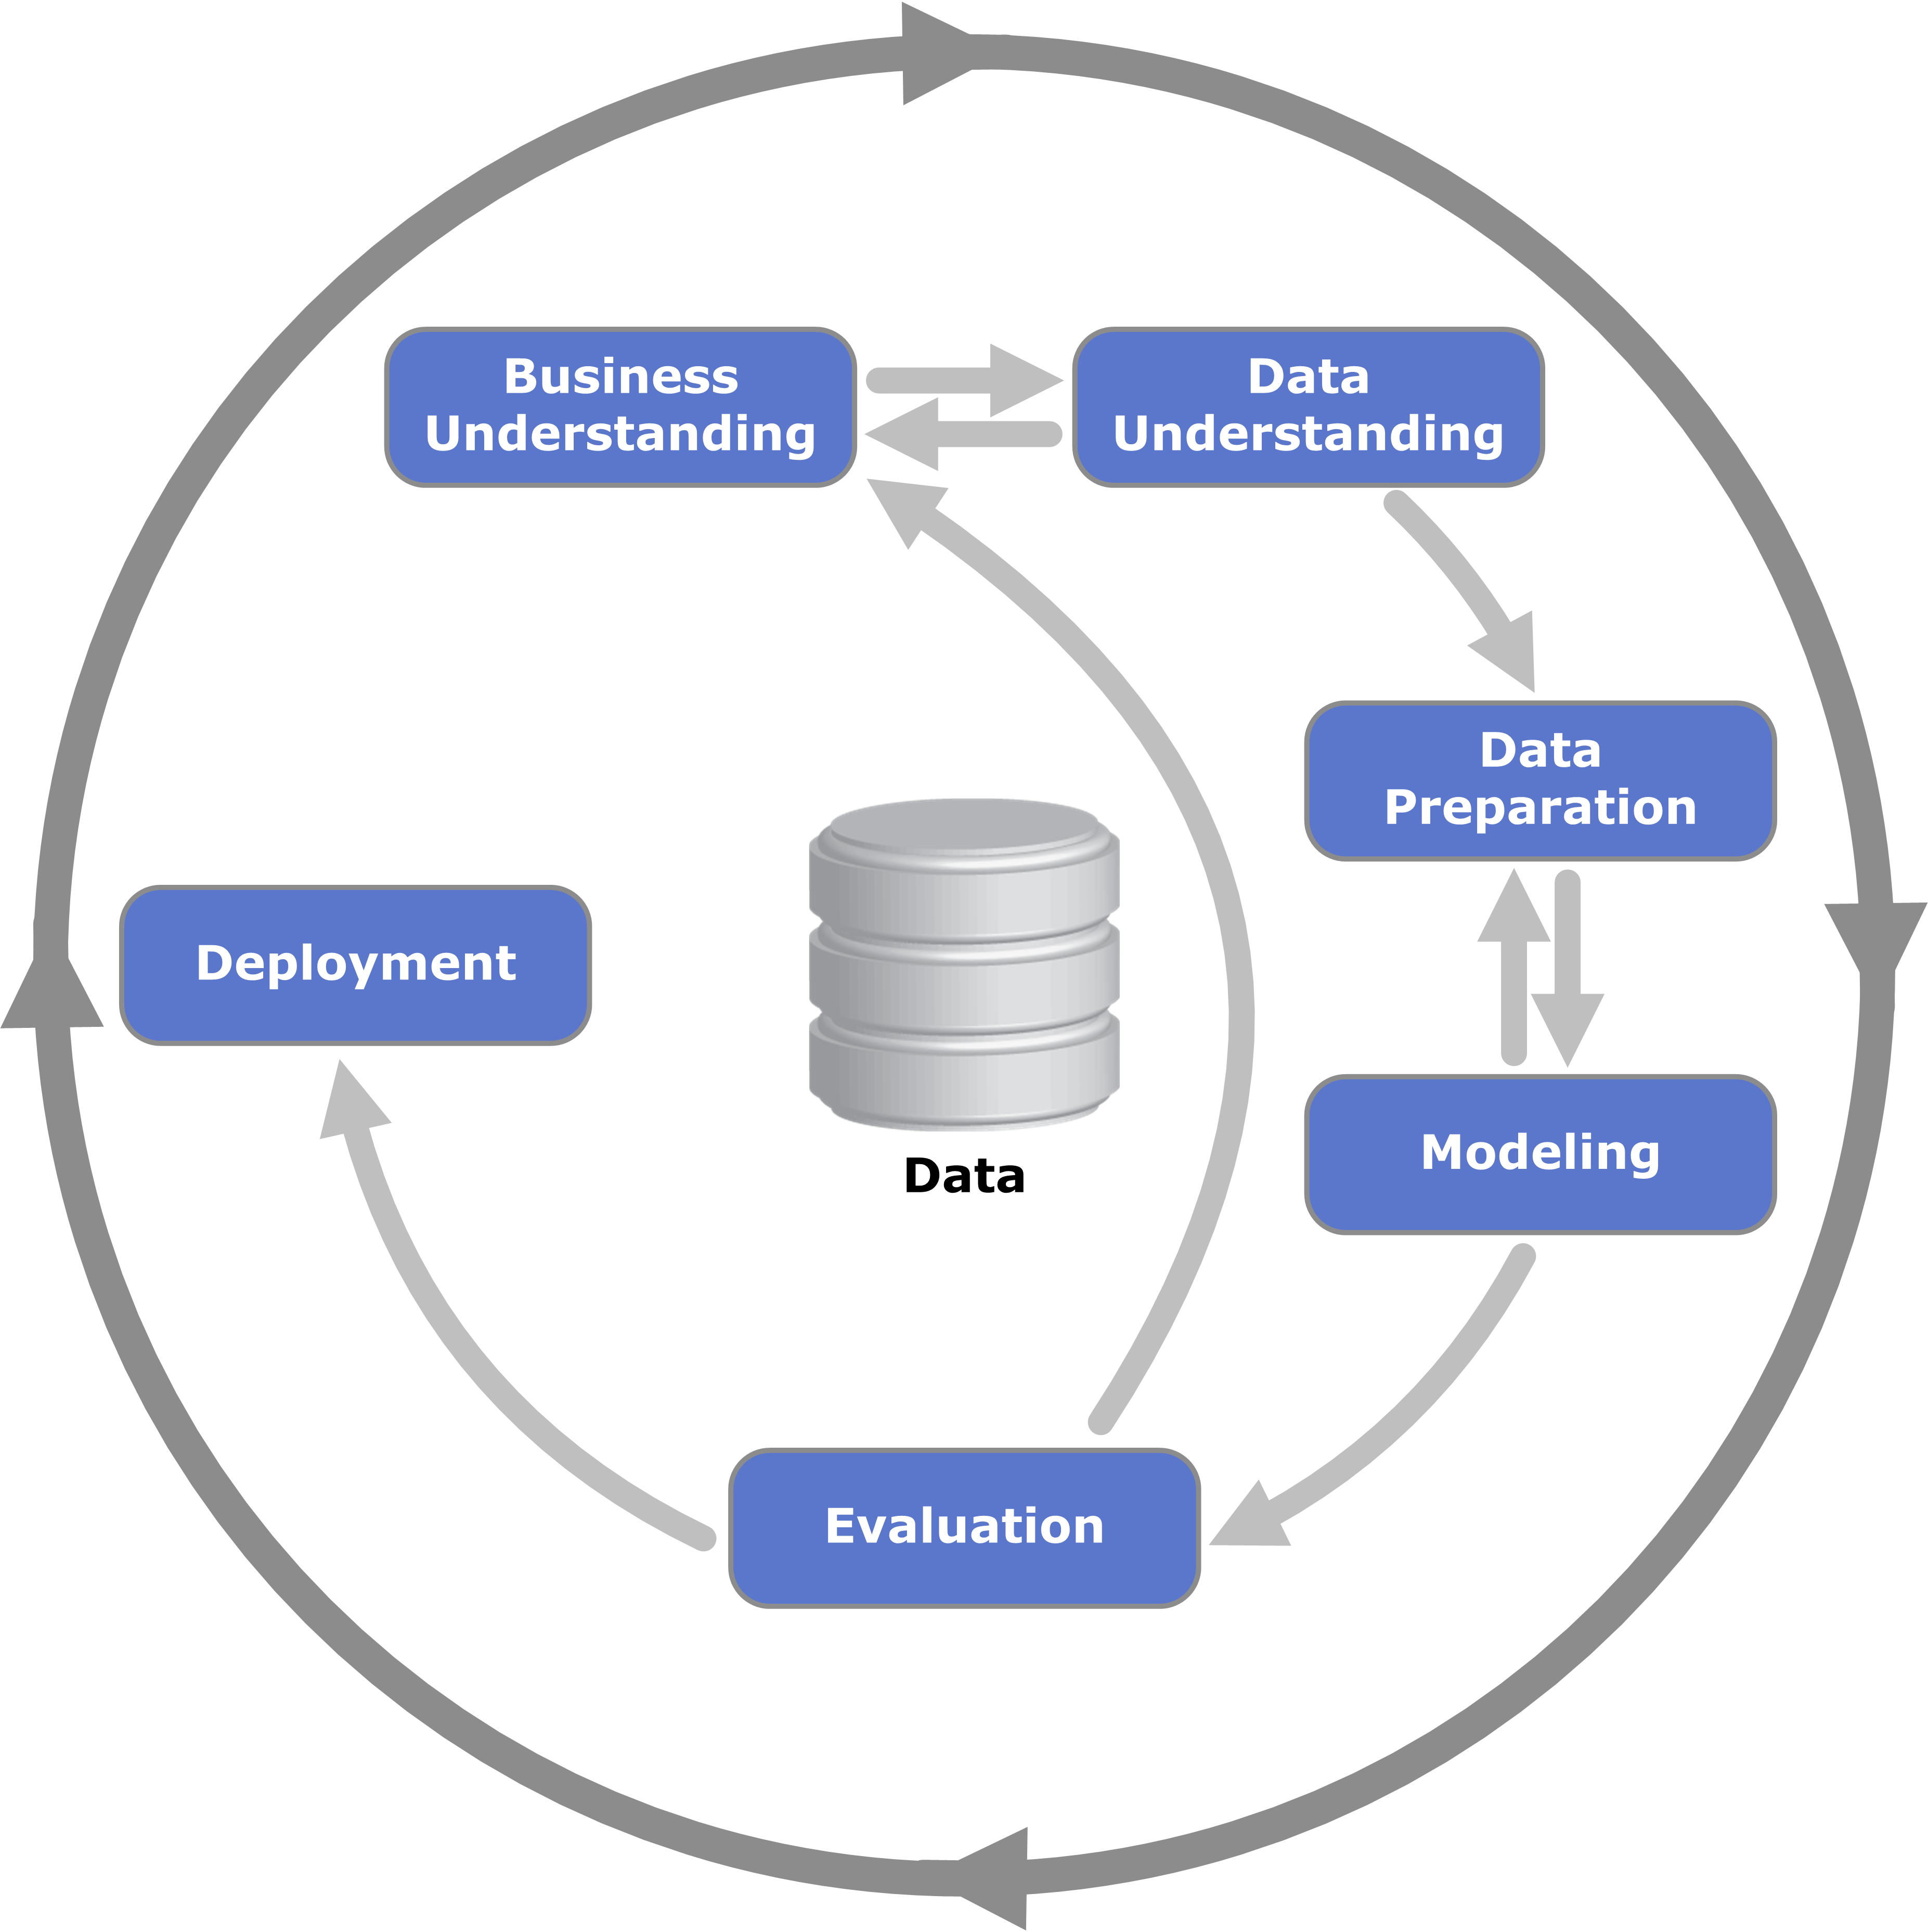
🛠️ Methodology
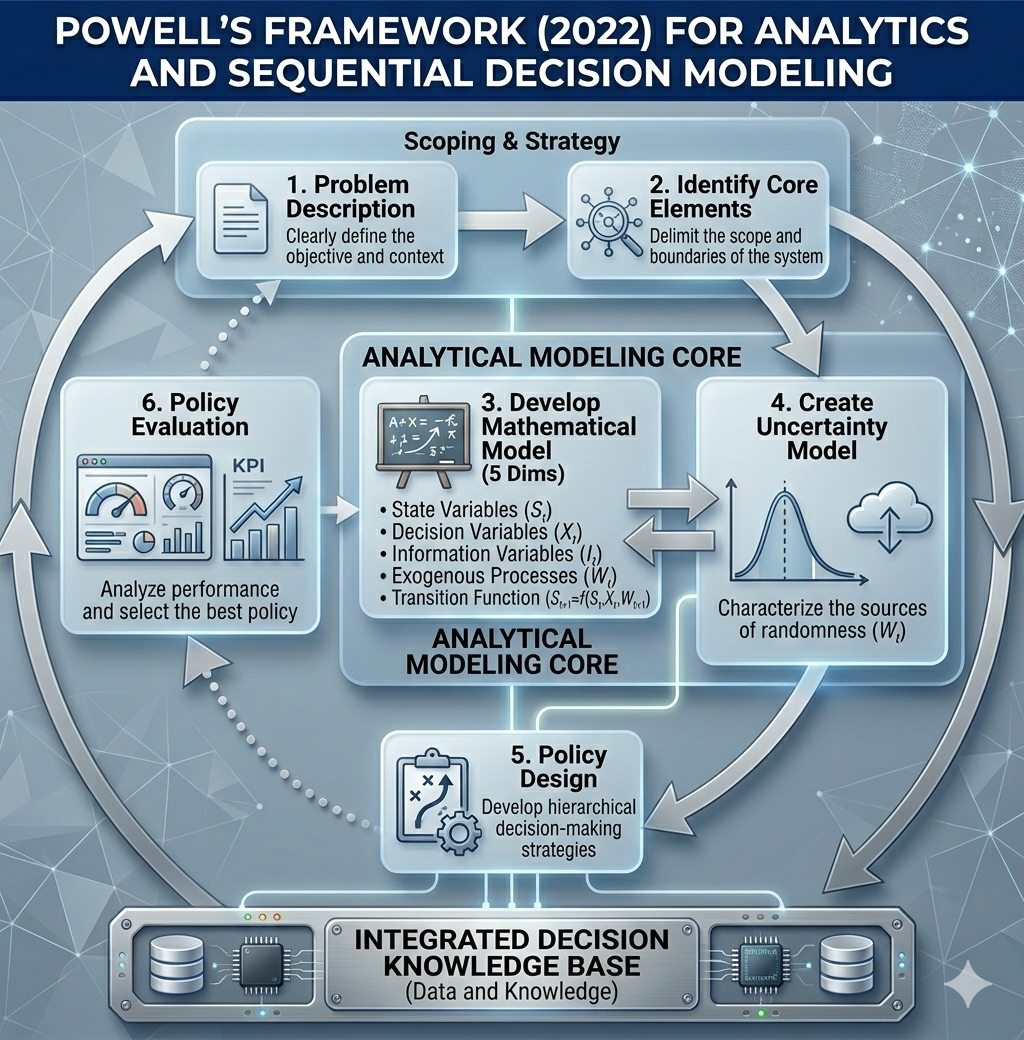
To find the optimal solution for those questions, we followed the methodology proposed by Warren B. Powell (2022) in Sequential Decision Analytics and Modeling: Modeling with Python and combined it with the Cross‑Industry Standard Process for Data Mining (CRISP‑DM) to define a machine learning model that powers the sequential decision.
Following the steps of both methodologies, we organized the articles created in this portfolio website:
🔮 What’s Next
- Interactive Demo: A Shiny web app where drivers can simulate their own earnings under different strategies.
- Real-World Pilot: Testing the policy with a small group of NYC drivers.
- Expansion: Adapting the model for other cities with similar trip data.
📁 Data to Use
In this project, we used a subset of the data available in the TLC Trip Record Data from 2022-2023 for High Volume For‑Hire Vehicle — which covers the Juno, Uber, Via and Lyft trips within our project scope — with the columns described in its data dictionary.
⚠️ Disclaimer
This project was completed under strong assumptions given that the data used in the analysis does not provide any unique identifier for taxi drivers, which limits the realism of some results.
Additionally, this project aims to increase taxi driver earnings at the individual level. However, if applied extensively, it could also produce the following unintended consequences:
Reduced service quality: Drivers focusing solely on maximizing earnings may avoid less profitable areas or times, potentially leaving some passengers underserved.
Increased congestion: Drivers congregating in high‑profit areas could worsen traffic in already busy parts of the city.
This project is intended as a demonstration of data science methodology rather than a prescriptive business recommendation, and these considerations should be carefully weighed before any real‑world implementation.
🧰 Project Structure and Tooling
Reproducibility and long‑term maintainability were core priorities from the start, which shaped every tooling decision in this project. The following tools were used to achieve this:
- 🔧 We use
gitto manage changes in the code and provide an interface to share the project on GitHub. - 🐳
DockerandNixare used to build a reproducible dev‑container based ondefault.nix. The container can be connected via SSH using a public and private key pair as defined insetup.sh, and the.envrcsets the Nix environment to use in the Positron console. - 📦 For modeling, we used the
tidymodelsframework to ensure we are following good modeling practices. - 📝 Since the project follows the basic structure of an R package, we were able to document and create unit tests for custom functions using
testthat,roxygen2anddevtools. This was especially important to ensure that the simulation function and the custom step function (which extends therecipespackage) work correctly. - 📄 The project also follows the structure of a Quarto project and renders all articles into the
docsfolder, giving us full control over the format used to present each article. Results are hosted on GitHub Pages, so they can be shared at no cost. - 🔒 The
.Rprofileoverridesinstall.packages,update.packagesandremove.packagesto make clear that R packages must be defined indefault.nixto ensure reproducibility. - 🗃️ To manage data larger than RAM, we use
duckdband keep large files in a separate folder namedNycTaxiBigFilesunder the same parent directory as this repo. - 💾 To cache results generated during the investigation process, we use
.qs2files and track them withpins, stored under the folderNycTaxiPinsin the same parent directory as this repo. - 🧹 We use the air extension to ensure consistent code formatting across the project.
The result is a hybrid structure that combines an R package (with documented functions and unit tests) and a Quarto website (with rendered articles and hosted results), which was one of the most challenging aspects of the project to set up correctly:
tree -L 3

.
├── air.toml
├── default.nix
├── DESCRIPTION
├── docker-compose.yml
├── Dockerfile
├── docs
│   ├── figures
│   │   ├── CRISP-DM_Process_Diagram.png
│   │   ├── Hour Tree Explanation-1.png
│   │   ├── htop_parallel_process.png
│   │   ├── logo-generated.jpeg
│   │   ├── Mean Hourly Wage after policy-1.png
│   │   ├── model_benefit_curve.png
│   │   ├── model-benefit.jpg
│   │   ├── nyc-taxi-navbar-logo.png
│   │   ├── nyc-taxi-navbar-logo.xcf
│   │   ├── screenshot-ui.png
│   │   ├── Sequential-Decision-Modeling-Framework.png
│   │   └── simulated_wage_vs_threshold.png
│   ├── index.html
│   ├── investigation-phases
│   │   ├── 01-business-understanding.html
│   │   ├── 02-data-collection-process.html
│   │   ├── 03-initial-exploration_files
│   │   ├── 03-initial-exploration.html
│   │   ├── 04-base-line_files
│   │   ├── 04-base-line.html
│   │   ├── 05-lookahead-labeling_files
│   │   ├── 05-lookahead-labeling.html
│   │   ├── 06-expanding-geospatial-data_files
│   │   ├── 06-expanding-geospatial-data.html
│   │   ├── 07-expanding-transportation-socioeconomic_files
│   │   ├── 07-expanding-transportation-socioeconomic.html
│   │   ├── 08-policy-function-approximation_files
│   │   ├── 08-policy-function-approximation.html
│   │   ├── 09-from-predictions-to-policies_files
│   │   ├── 09-from-predictions-to-policies.html
│   │   ├── 10-optimal-starting-states_files
│   │   └── 10-optimal-starting-states.html
│   ├── man
│   │   └── figures
│   ├── search.json
│   └── site_libs
│       ├── bootstrap
│       ├── clipboard
│       ├── DiagrammeR-styles-0.2
│       ├── ggiraphjs-0.9.2
│       ├── girafe-binding-0.9.2
│       ├── grViz-binding-1.0.11
│       ├── htmltools-fill-0.5.8.1
│       ├── htmlwidgets-1.6.4
│       ├── jquery-3.6.0
│       ├── leaflet-1.3.1
│       ├── leaflet-binding-2.2.3
│       ├── leafletfix-1.0.0
│       ├── Leaflet.glify-3.2.0
│       ├── leaflet-providers-2.0.0
│       ├── leaflet-providers-plugin-2.2.3
│       ├── proj4-2.6.2
│       ├── Proj4Leaflet-1.0.1
│       ├── quarto-html
│       ├── quarto-nav
│       ├── quarto-search
│       ├── rstudio_leaflet-1.3.1
│       └── viz-1.8.2
├── figures
│   ├── CRISP-DM_Process_Diagram.png
│   ├── Hour Tree Explanation-1.png
│   ├── htop_parallel_process.png
│   ├── Mean Hourly Wage after policy-1.png
│   ├── model_benefit_curve.png
│   ├── nyc-taxi-navbar-logo.png
│   ├── nyc-taxi-navbar-logo.xcf
│   ├── Sequential-Decision-Modeling-Framework.png
│   └── simulated_wage_vs_threshold.png
├── index.qmd
├── investigation-phases
│   ├── 01-business-understanding.qmd
│   ├── 02-data-collection-process.qmd
│   ├── 03-initial-exploration.qmd
│   ├── 04-base-line.qmd
│   ├── 05-lookahead-labeling.qmd
│   ├── 06-expanding-geospatial-data.qmd
│   ├── 07-expanding-transportation-socioeconomic.qmd
│   ├── 08-policy-function-approximation.qmd
│   ├── 09-from-predictions-to-policies.qmd
│   └── 10-optimal-starting-states.qmd
├── man
│   ├── add_performance_variables.Rd
│   ├── add_pred_class.Rd
│   ├── add_take_current_trip.Rd
│   ├── calculate_costs.Rd
│   ├── collect_predictions_best_config.Rd
│   ├── compare_model_predictions.Rd
│   ├── compute_power.Rd
│   ├── figures
│   │   ├── logo.hex
│   │   ├── logo-image.png
│   │   ├── logo.png
│   │   └── Logo-source.txt
│   ├── NycTaxi-package.Rd
│   ├── optimize_trip_start_time.Rd
│   ├── plot_bar.Rd
│   ├── plot_box.Rd
│   ├── plot_heap_map.Rd
│   ├── plot_num_distribution.Rd
│   ├── required_pkgs.step_join_geospatial_features.Rd
│   ├── sim_start_trip_summary.Rd
│   ├── simulate_trips.Rd
│   └── step_join_geospatial_features.Rd
├── multicore-scripts
│   ├── 01-fine-tune-future-process.R
│   ├── 02-add-target.R
│   ├── 02-run_add_target.sh
│   ├── 03a-tuning-simple-models.R
│   ├── 03b-tuning-dimreduction-models.R
│   └── 03c-tuning-tree-models.R
├── NAMESPACE
├── nix
│   ├── pkgs.nix
│   ├── r-core.nix
│   ├── r-custom.nix
│   ├── r-data.nix
│   ├── r-geo.nix
│   ├── r-ml.nix
│   └── system.nix
├── params.yml
├── _quarto.yml
├── R
│   ├── add_take_current_trip.R
│   ├── calculate_costs.R
│   ├── compare_model_predictions.R
│   ├── compute_power.R
│   ├── NycTaxi-package.R
│   ├── optimize_trip_start_time.R
│   ├── plot_bar.R
│   ├── plot_box.R
│   ├── plot_heap_map.R
│   ├── plot_num_distribution.R
│   ├── sim_start_trip_summary.R
│   ├── simulate_trips.R
│   ├── step_join_geospatial_features.R
│   └── utils.R
├── README.md
├── setup.sh
└── tests
    ├── testthat
    │   ├── fixtures
    │   ├── test-add_take_current_trip.R
    │   ├── test-calculate_costs.R
    │   ├── test-plot_box.R
    │   ├── test-sim_start_trip_summary.R
    │   ├── test-simulate_trips.R
    │   └── test-step_join_geospatial_features.R
    └── testthat.R

47 directories, 109 files
🖥️ Defining Development Environment
To reproduce the results of this project, follow these steps to set up the same environment using Docker and Nix.
1. 🐳 Install Docker and Docker Compose
You need Docker and Docker Compose. Choose the appropriate installation method for your operating system:
- Windows or macOS: Install Docker Desktop (includes Docker Compose).
- Linux: Install the Docker Engine and then Docker Compose.
For Debian 13 (as an example), run the following as root:
apt update
apt install -y apt-transport-https ca-certificates curl gnupg2 software-properties-common
curl -fsSL https://download.docker.com/linux/debian/gpg | apt-key add -
add-apt-repository "deb [arch=amd64] https://download.docker.com/linux/debian trixie stable"
apt update
apt install -y docker-ce docker-compose-plugin
systemctl enable docker && systemctl start docker
usermod -aG docker <YOUR-USER>
su - <YOUR-USER>
Note: Replace <YOUR-USER> with your actual username.
2. 📂 Clone the Repository and Prepare Directories
Navigate to the parent directory where you want to store the project and the data folders. Then run:
cd <parent-dir-path>
mkdir NycTaxiBigFiles
mkdir NycTaxiPins
git clone https://github.com/AngelFelizR/NycTaxi
Your directory structure should look like:
<parent-dir-path>/
├── NycTaxi/               # cloned repository
├── NycTaxiBigFiles/       # large data files (mounted into container)
└── NycTaxiPins/           # pin board storage (mounted into container)
3. ⚙️ Run the Setup Script
The repository includes a setup.sh script that automates all remaining steps: pulling the image, starting the container, and configuring SSH key‑based authentication using your existing ~/.ssh/id_rsa.pub.
From inside the NycTaxi folder, run:
cd NycTaxi
chmod +x setup.sh
./setup.sh
The script will:
- Pull the pre‑built image
angelfelizr/nyc-taxi:4.5.2from Docker Hub. - Start the container in detached mode, mapping port
2222for SSH and mounting the three directories under/root/. - Register your public key (
~/.ssh/id_rsa.pub) inside the container so you can connect without a password.
#!/bin/bash
docker compose pull
docker compose up -d
docker compose cp ~/.ssh/id_rsa.pub nyc-taxi:/root/.ssh/authorized_keys
docker compose exec nyc-taxi chown root:root /root/.ssh/authorized_keys
docker compose exec nyc-taxi chmod 600 /root/.ssh/authorized_keys
echo "Ready! Connect with: ssh NycTaxi"
You can verify the container is running with docker compose ps.
4. 🔑 Configure SSH
Add the following to your ~/.ssh/config so you can connect with a simple alias:
Host NycTaxi
    HostName 127.0.0.1
    User root
    Port 2222
    IdentityFile ~/.ssh/id_rsa
Then connect with:
ssh NycTaxi5. 🧑💻 Using Positron (or VS Code) with direnv
Since direnv is configured via the .envrc file in the repository, you can use Positron with the SSH remote development feature to work directly inside the container.
- In Positron, select “Connect to Host…” (or use the Remote Explorer).
- Enter
root@localhost:2222and authenticate using your SSH key (configured in Step 3). - Once connected, open the folder
/root/NycTaxi. - Install the direnv extension by mkhl from the Open VSX Registry. This extension automatically activates direnv when you open a folder containing an
.envrcfile.
After the extension loads, you should see a notification confirming that direnv is active. At that point, any terminal you open inside Positron will have the Nix environment loaded automatically.
To make the R interactive console use the Nix environment instead of the system default, open the Positron command palette and switch the active R interpreter to the one provided by the Nix shell. Once selected, the console will have access to all the R packages defined in default.nix.
6. 📦 Remote Pin Board (Optional)
If you need to use the shared pin board, create a cache directory on your host (outside the container) and then, inside R, set up the board as follows:
# On your host (in <parent-dir-path>)
mkdir NycTaxiBoardCache
In your R session (inside the Nix shell), use:
BoardRemote <- board_url(
  "https://raw.githubusercontent.com/AngelFelizR/NycTaxiPins/refs/heads/main/Board/",
  cache = here::here("../NycTaxiBoardCache")
)
The cache directory is mounted into the container at /root/NycTaxiBoardCache, so pins will be stored on your host and persist between container restarts.